

What you’ll learn in this article…
- GMAT Focus Edition total scores range from 205 to 805 and always end in 5, built from three equally weighted sections scored 60 to 90.
- A 655 total sits at roughly the 91st percentile, so raw scores alone can be misleading without percentile context.
- M7 programs typically expect scores of 705 or higher, while strong regional MBA candidates often land near 615 to 645.
- Scoring 30 to 50 points above a program's class median can unlock $20,000 to $60,000 in merit scholarships.
When GMAC retired the classic GMAT and introduced the Focus Edition in 2023, it also replaced the familiar 200, 800 scale with a new 205, 805 range where every possible total score ends in 5. That single change has confused applicants, admissions consultants, and even test-prep instructors who built years of intuition around the old scale.
The confusion is practical, not cosmetic. A 645 on the Focus Edition does not map cleanly to a 640 on the classic exam. Percentile ranks shift. Program medians published before 2024 reflect a different instrument. Applicants comparing their scores to older admitted-class data, or to peers who tested under the prior format, are often working with an inaccurate mental model.
For M7 programs, median Focus Edition totals now sit above 730, placing admitted students at roughly the 96th percentile or higher. At top-15 schools the typical range compresses around 680 to 710. Regional and accredited online MBA programs may accept competitive candidates well below 650. Knowing which benchmark applies to your target school is the only number that matters.
How the GMAT Focus Edition Scoring Works (205–805)
How does the GMAT Focus Edition convert three section scores into a single total score, and why does every possible total land on a multiple of 10 that ends in 5?
The Three Building Blocks
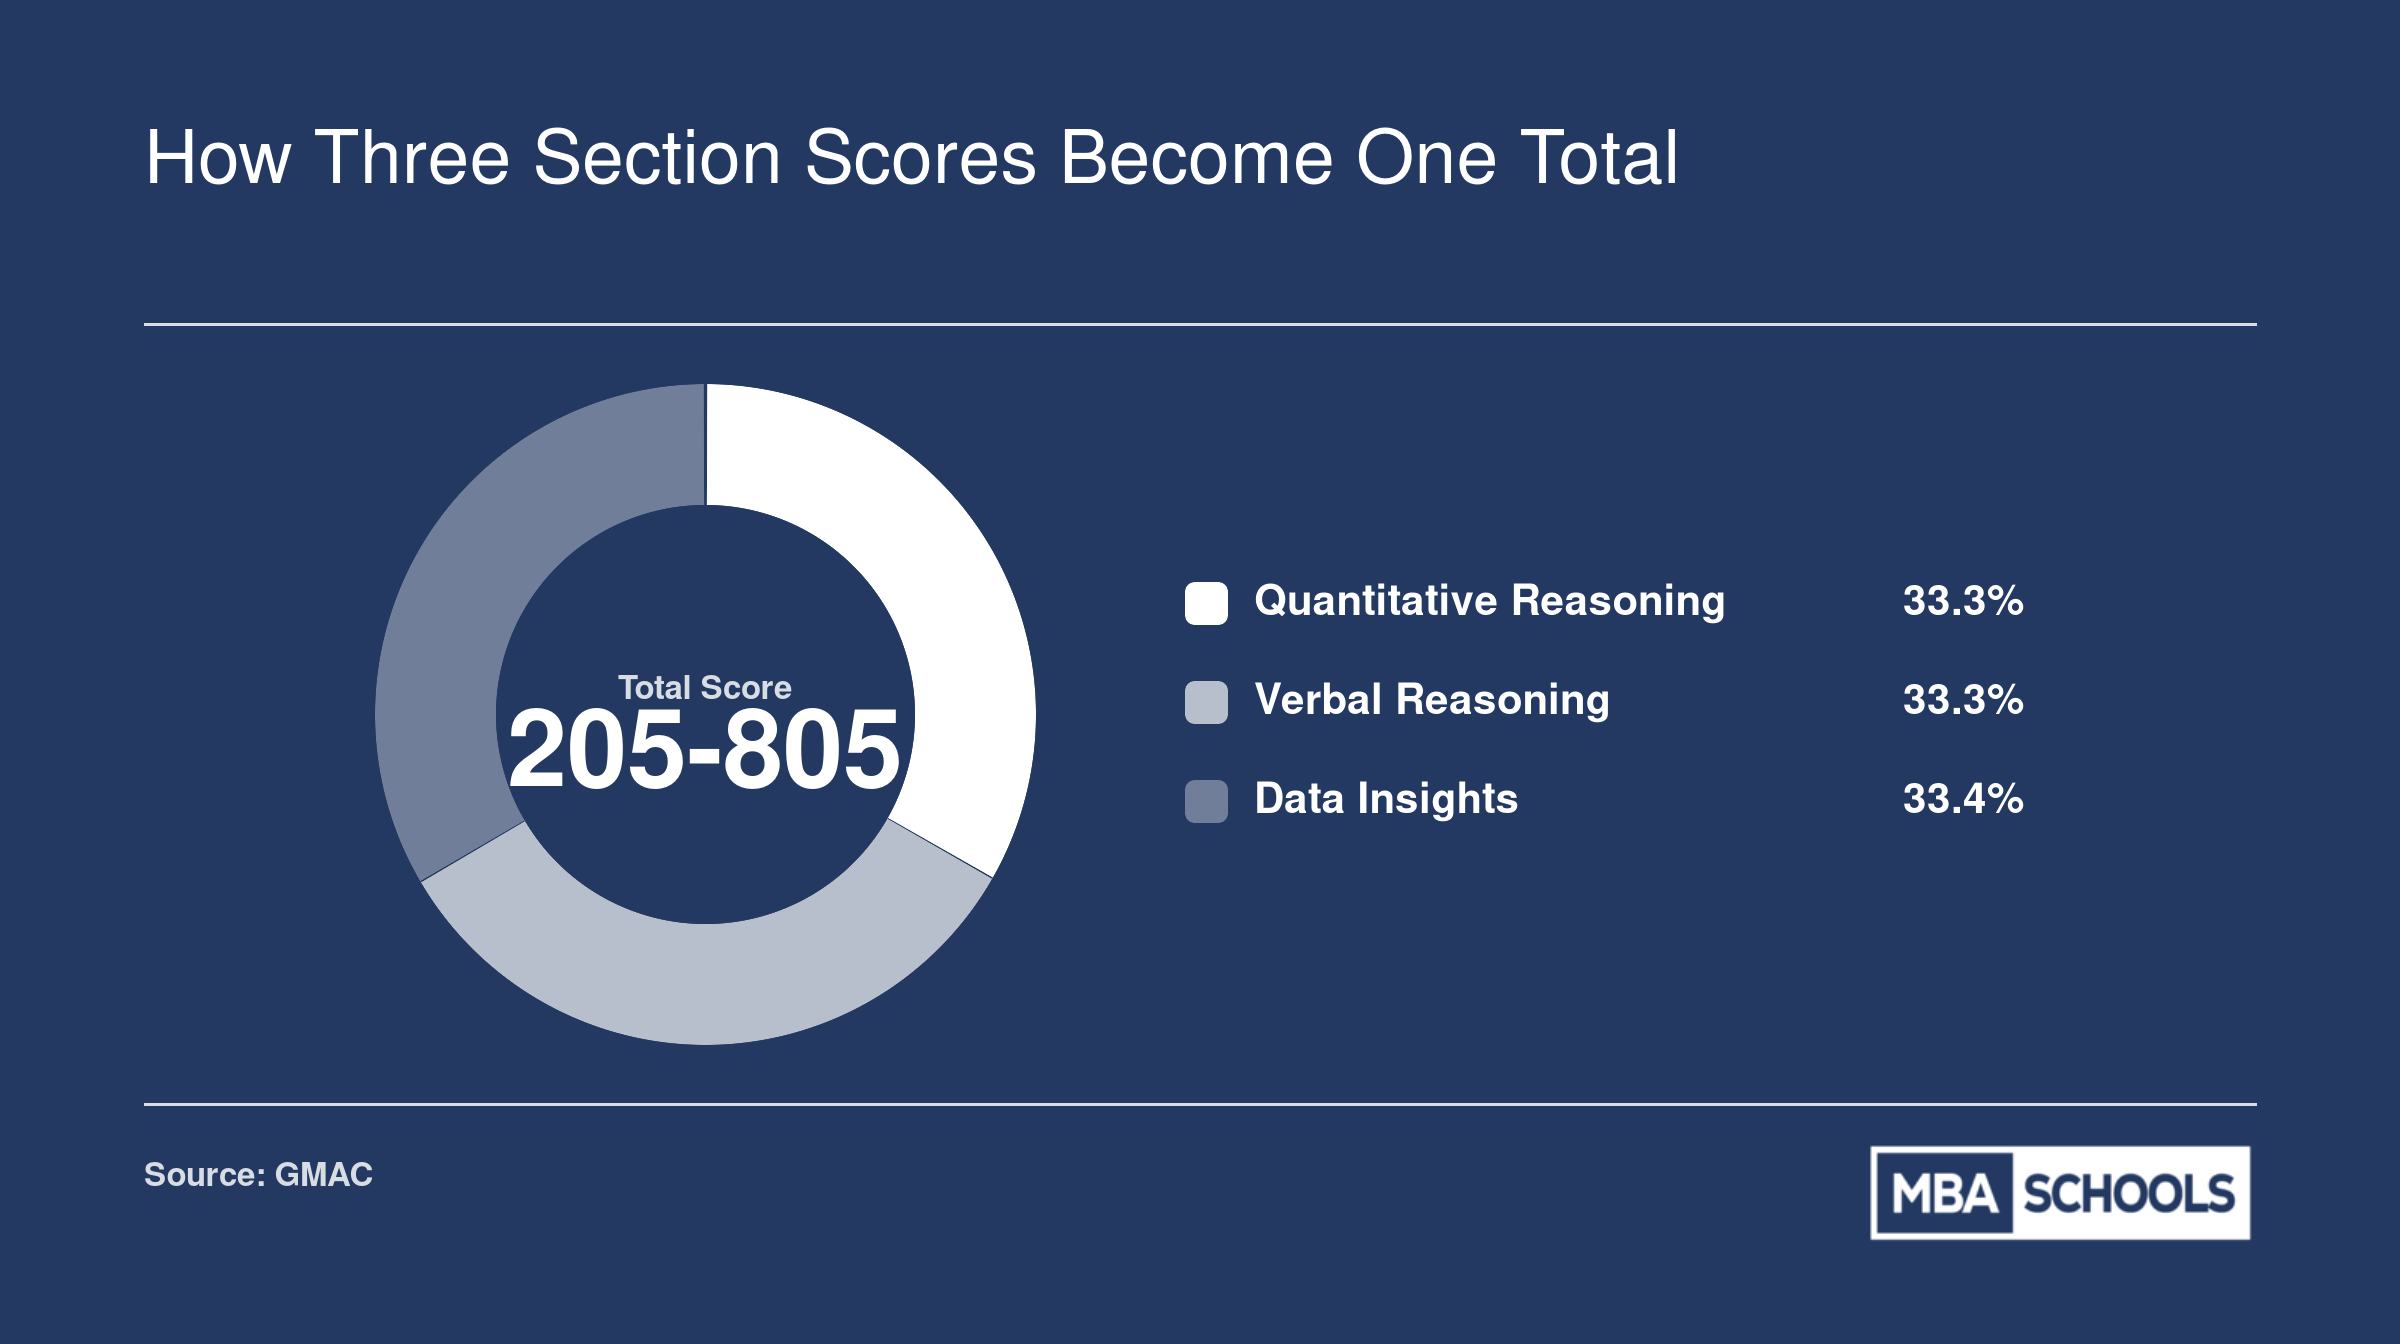
The GMAT Focus Edition consists of three equally weighted sections: Quantitative Reasoning, Verbal Reasoning, and Data Insights.1 Each section is scored on a scale from 60 to 90, in 1-point increments. Your performance in all three areas contributes equally to your final total, meaning there is no extra weight given to quantitative or verbal skills over data interpretation.
The Combination Algorithm
GMAC transforms your three section scores into a total score ranging from 205 to 805. Every possible total score ends in 5 and moves in 10-point steps: 205, 215, 225, all the way up to 805. This pattern is not the result of rounding. It is a deliberate design choice built into the scoring algorithm. By ensuring all totals end in 5, GMAC creates a visual distinction between the Focus Edition and the classic GMAT's 200 to 800 scale, which always ends in 0.1 Although the exact formula or lookup table that maps section scores to the total score is not publicly disclosed, the equal weighting and the consistent 10-point increments are the system's defining features. If you are still deciding between the GMAT and other options, our overview of MBA entrance exams can help you compare formats and requirements.
Adaptive Scoring Behind the Numbers
Behind each section score is a computer-adaptive testing engine. The exam does not simply count the number of correct answers; it evaluates the difficulty level of the questions you answer correctly. As you progress through a section, the test adjusts the difficulty of subsequent questions based on your performance. Your final section score reflects the highest level of difficulty you consistently managed, not a raw percentage of correct responses. This makes percentiles a more meaningful comparison across test-takers than raw scores alone. Building a structured study plan around this adaptive format is essential, and our GMAT preparation tips cover section-by-section strategies.
A Deliberate Break From the Classic GMAT
GMAC explicitly advises against making direct numerical comparisons between Focus Edition scores (205 to 805) and the old GMAT (200 to 800). The new scale was shifted to prevent treating a 645 on the Focus Edition as equivalent to a classic 650. Separate concordance tables exist for those who need to translate between the two exams, but the scoring architecture itself was built to signal that the exams are fundamentally different assessments.3 The consistent ending digit of 5 throughout the total score range is simply one visible marker of that separation.
How Three Section Scores Become One Total
Your GMAT Focus Edition total score is built from three equally weighted sections. No single section carries more influence than the others, so balanced preparation across all three areas matters. Each section is scored on a 60 to 90 scale, and the algorithm combines them into a single total that falls on the 205 to 805 range, with every possible total ending in 5.
Full GMAT Score Chart: Section Scores to Total Score
The GMAT Focus Edition maps three section scores (Quantitative Reasoning, Verbal Reasoning, and Data Insights, each ranging from 60 to 90) onto a single total score between 205 and 805.1 Every total score ends in 5, and GMAC's scaling algorithm weights the three sections equally. While the Graduate Management Admission Council publishes the psychometric principles behind the scale, they do not release a complete lookup table that exhaustively pairs every possible section-score triplet with its resulting total. Test-takers and prep firms have reverse-engineered portions of the mapping, and GMAT Club maintains a widely cited score calculator that reflects community observations and official anchor points confirmed by GMAC.2
Key Anchor Points
A handful of section-score combinations serve as reference milestones. When all three sections land at their minimum (Quant 60, Verbal 60, Data Insights 60) the total score is 205, the floor of the scale.1 A balanced 75 in each section produces a total of 575. Scoring 85 across the board yields 705, and a perfect triplet of 90s delivers 805.2 These anchor points confirm that the scale is roughly additive with modest nonlinear adjustments, and they also show that every additional scaled point on a section translates into a handful of points on the total score.
Uneven Section Scores
Most candidates do not score the same value in all three sections. A test-taker might earn Quant 82, Verbal 78, and Data Insights 80, a profile that yields a total around 675 according to the GMAT Club calculator. Another candidate with Quant 88, Verbal 72, and Data Insights 84 may also land near 675, even though the section-score distribution differs. GMAC's algorithm ensures that a one-point gain in any section has the same average weight, so a balanced profile and a lopsided profile with the same section-score sum will cluster near the same total, plus or minus a few points due to rounding and the discrete nature of the scale.
Why No Official Master Table?
GMAC treats the exact conversion formula as proprietary psychometric information, in part to discourage gaming and in part because the computer-adaptive engine delivers section scores based on item-response theory, which already builds in statistical uncertainty. Publishing a complete table would imply false precision, since the margin of error on each section score is roughly plus or minus two points. Candidates who want a quick estimate can use the GMAT Club calculator or round each section score to the nearest multiple of five, sum the three values, then multiply by a scaling factor of roughly 2.7 to approximate the total. For example, 82 + 78 + 80 equals 240, and 240 × 2.7 approximates 648, which will fall within a few points of the official total on test day.
Practical Implications
Admissions committees review both the total score and the section breakdown. A 705 total with all three sections in the mid-eighties signals well-rounded quantitative and verbal strength. A 705 with Quant 90, Verbal 70, and Data Insights 85 may raise questions at programs that value communication skills. For candidates building a GMAT study schedule, the full chart reminds them that the total is only one dimension of a multifaceted score report, and that balanced improvement across sections often matters as much as chasing the highest possible total.
Questions to Ask Yourself
GMAT Focus Percentile Tables: Total, Quant, Verbal, and Data Insights
Percentile rankings reveal far more about your competitive standing than a raw number on the 205, 805 scale. A 655 total score may look middling, but at the 91st percentile, it actually places you ahead of nine out of ten test-takers.1 Understanding these percentiles across total score and each section is essential for setting realistic target scores and identifying which areas offer the greatest room for improvement.
Total Score Percentiles
Total score percentiles on the GMAT Focus Edition are not evenly distributed. The scale compresses at the top: moving from 655 to 705 jumps you from the 91st to the 98th percentile, while the same 50-point gain lower down (505 to 555) yields a larger percentile lift (27th to 48th).1
- 805: 100th percentile
- 755: 100th percentile
- 705: 98th percentile
- 655: 91st percentile
- 605: 70th percentile
- 555: 48th percentile
- 505: 27th percentile
- 455: 15th percentile
Because the GMAT Focus is relatively new, these percentiles are based on the initial testing cohorts (2023, 2025). GMAC periodically recalibrates them, so future updates may shift slightly, but the current tables are the most accurate benchmark for the 2026 application cycle.
Quantitative Reasoning Percentiles
Quant scores show a pronounced clustering at both extremes. A perfect 90 lands at the 100th percentile, but dropping just five points to 85 puts you at the 88th percentile. The middle range is sparse: a 75 is only the 32nd percentile, meaning that two-thirds of test-takers outperform that score.2
- 90: 100th percentile
- 85: 88th percentile
- 80: 64th percentile
- 75: 32nd percentile
- 70: 12th percentile
Verbal Reasoning Percentiles
Verbal Reasoning displays an even steeper curve. A 90 is again the 100th percentile, but a 10-point drop to 80 cuts your percentile from 100 to 57. The slope then flattens dramatically: a 75 is the 18th percentile, and a 70 is just the 4th percentile.2 For MBA applicants targeting top programs, maintaining a Verbal score at or above 85 (94th percentile) is a common benchmark. For a broader look at what is a competitive GMAT score for MBA admissions, explore our dedicated breakdown.
- 90: 100th percentile
- 85: 94th percentile
- 80: 57th percentile
- 75: 18th percentile
- 70: 4th percentile
Data Insights Percentiles
Data Insights percentiles offer more granularity at the high end. The top score (90) is the 100th percentile, but an 85 still sits at the 98th percentile, and an 80 at the 84th.2 This reflects the section's novelty; many test-takers are still building the skills it demands, so strong performance separates you clearly from the pack.
- 90: 100th percentile
- 85: 98th percentile
- 80: 84th percentile
- 75: 48th percentile
- 70: 21st percentile
What These Percentiles Reveal
The single most important insight is that total score percentiles are not a simple average of section percentiles. A 655 total (91st percentile) can be built from very different section profiles, perhaps an exceptional Verbal, a solid Data Insights, and a modest Quant. MBA admissions committees evaluate sectional balance, not just the total. Use these tables to diagnose where a modest score improvement can yield the greatest percentile gain, and calibrate your study plan accordingly.
Related Articles
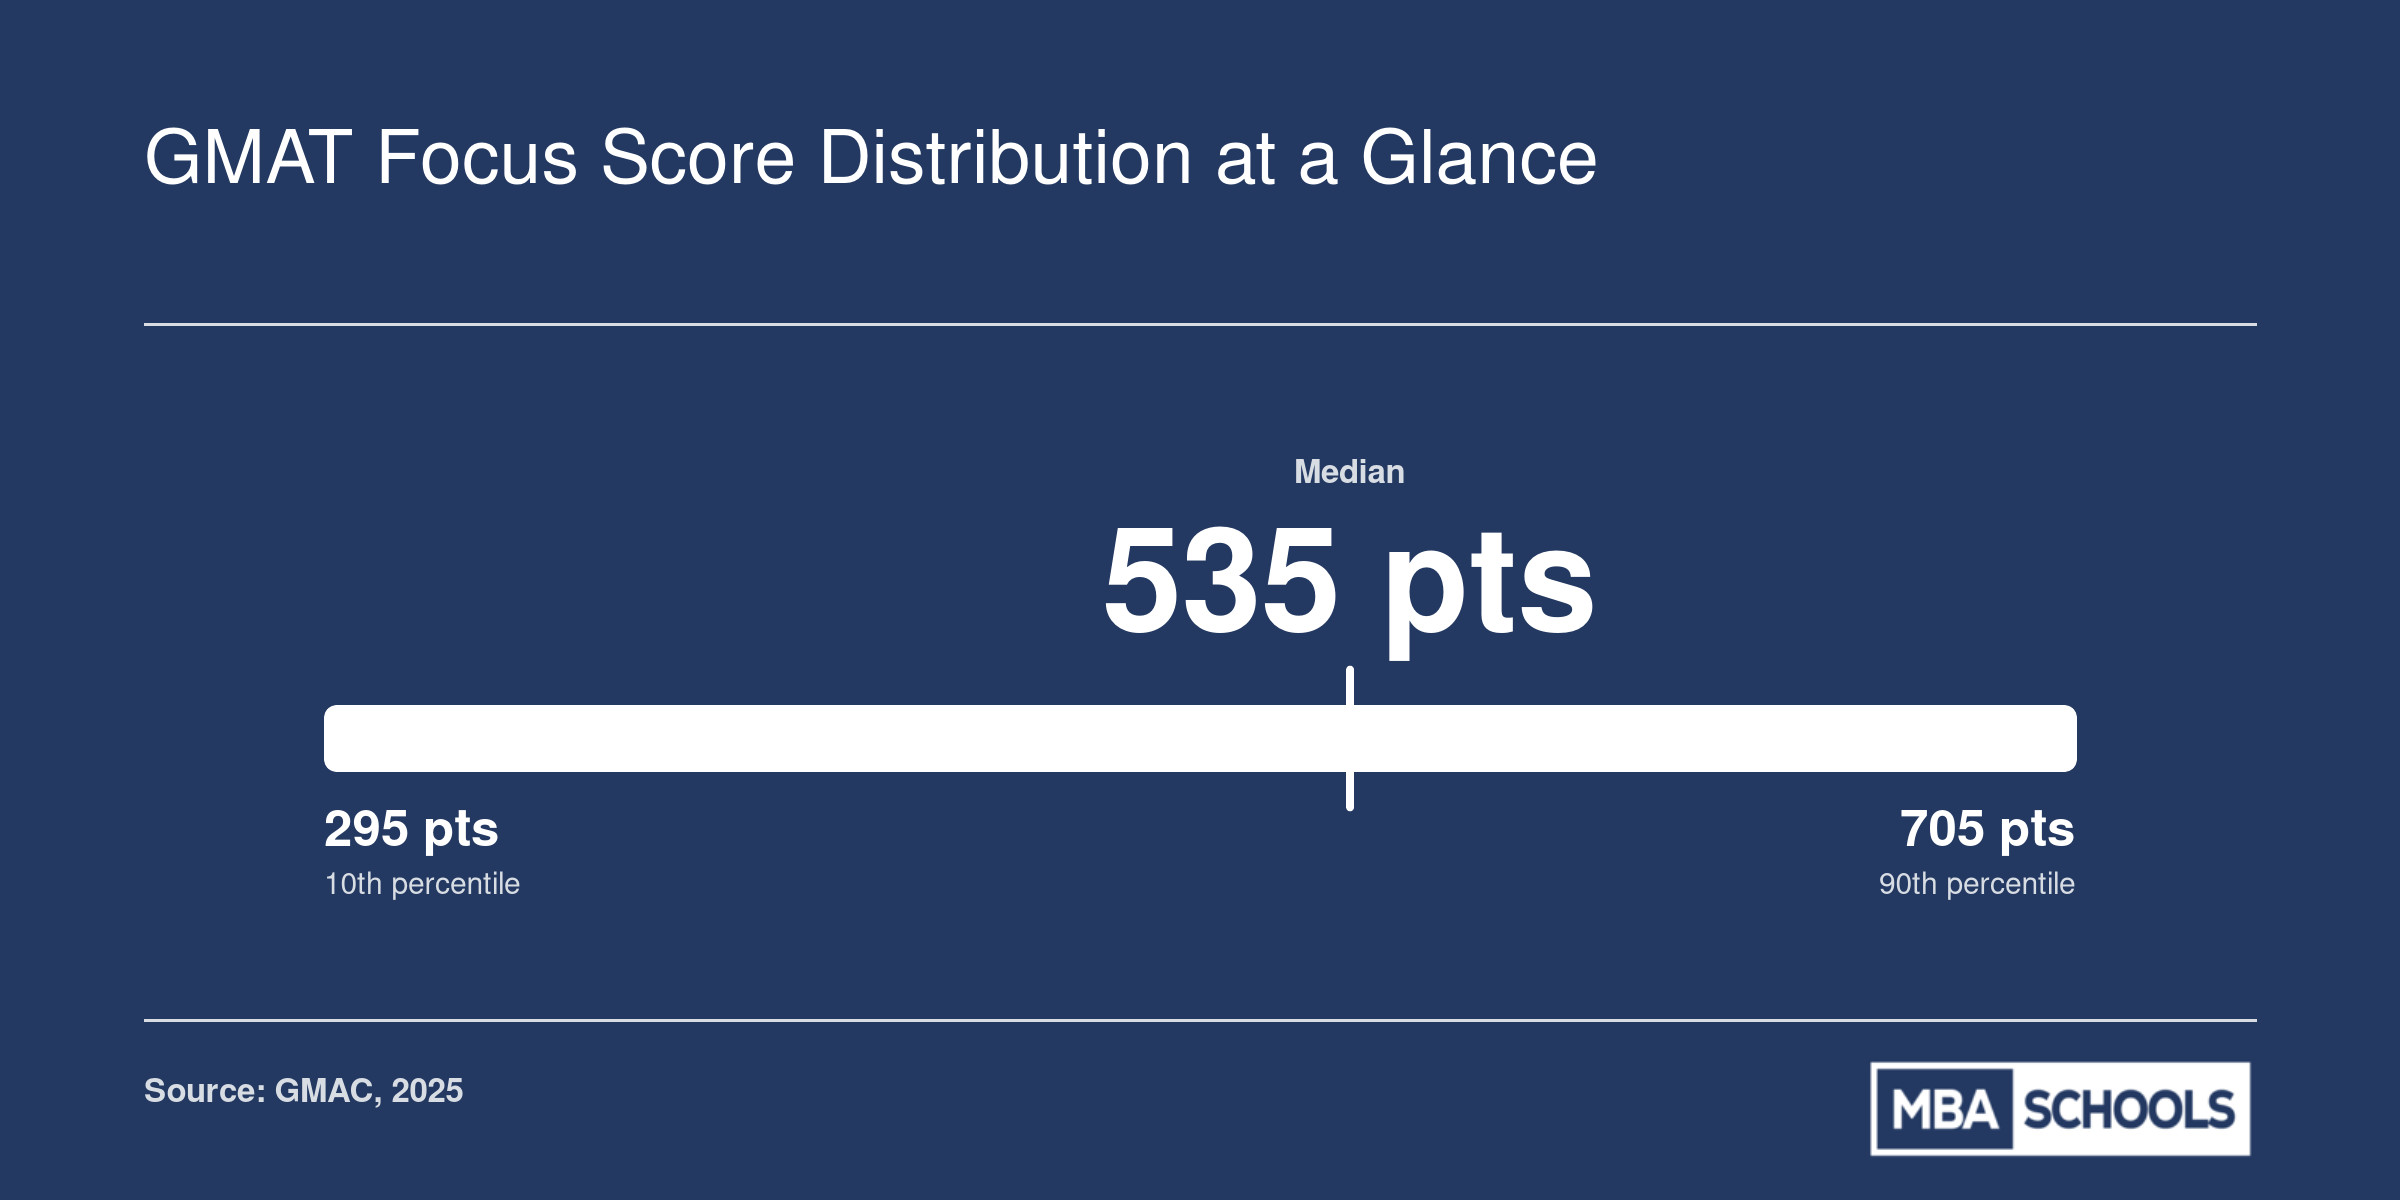
GMAT Focus Score Distribution at a Glance
The chart below maps where key percentile benchmarks fall on the GMAT Focus Edition's 205 to 805 total score scale. Use it to see, at a glance, how your score compares with the full population of test-takers. GMAC updates official percentile tables annually, so check mbaschools.org for the latest figures.
Classic GMAT to Focus Edition Score Concordance
The move from the 200-800 legacy scale to the 205-805 Focus Edition has created a common point of confusion for MBA applicants. While both exams assess analytical and reasoning skills, a simple linear conversion between the two scoring systems is not possible. The Focus Edition eliminates geometry, changes the verbal reasoning item mix, and introduces the Data Insights section as an integrated component with equal weight in the total score. Consequently, the meaning of a 650 on the classic GMAT is not the same as a 650 on the Focus Edition.
Why a Direct Conversion Is Misleading
The classic GMAT total score was built from Quantitative and Verbal sections only, with Analytical Writing and Integrated Reasoning reported separately. The Focus Edition total score combines Quantitative, Verbal, and Data Insights, each contributing equally. This structural difference means two test takers with identical classic total scores could map to different Focus Edition scores depending on their underlying performance profiles. The GMAC concordance reflects this nuance by providing ranges, not single-point equivalents.1
Concordance Table: Classic to Focus Edition
Below is a simplified mapping based on GMAC's official concordance, released in 2024. It shows how common classic score benchmarks align with Focus Edition ranges and their corresponding percentiles.2
| Classic GMAT (200-800) | Focus Edition Range (205-805) | Percentile |
|---|---|---|
| 600 | 565-575 | 52-59% |
| 650 | 605-615 | 74-75% |
| 700 | 645-655 | 89% |
| 750 | 705-715 | 98-99% |
A score of 645 on the Focus Edition is the closest parallel to the iconic 700 on the classic test.3 Similarly, a 615 Focus Edition lines up with older 680 scores.3 Notice that the percentile bands remain narrow: the 89th percentile still marks the 700 club, even as raw numbers shift.4
Why Percentiles Offer a Better Bridge
Because the score scales are constructed differently, the true bridge between editions is the percentile rank, not the raw score. A 700 on the classic GMAT always meant "better than roughly 89% of test takers," and that quality benchmark persists. When schools review applications containing both classic and Focus Edition scores, they look first to percentile performance to compare candidates equitably. For a deeper look at what MBA admissions committees look for, remember that percentile standing is just one element in a holistic review. Focusing on your percentile rank also protects you from misinterpretation as class profiles begin to list both scales.
What This Means for Your Application
Many business schools are still updating class profiles and admission statistics to reflect Focus Edition data. For the next few admissions cycles, you may see both scales reported side by side. If you hold a classic GMAT score, identify its Focus Edition range using the concordance, then anchor your expectations on the percentile. Pairing this concordance work with a structured GMAT study schedule can help you close any gap between your current standing and your target. That consistency allows you to gauge your competitiveness accurately regardless of which edition appears on your report.
What Is a Good GMAT Focus Score for MBA Programs?
The definition of a "good" GMAT Focus score depends entirely on where you plan to apply. A score that positions you as a strong candidate at one tier of programs might place you below the median at another. Understanding how your score stacks up against recently admitted classes helps you build a realistic school list and identify where you might need to strengthen other parts of your application.
M7 Programs: The 670, 690 Reality
The seven most selective MBA programs in the United States, often called the M7, reported average and median GMAT Focus scores between 670 and 690 for their Class of 2027.1 Here is what each school reported:
- Stanford GSB: 689 average, with a middle 80 percent range of 615, 785
- Columbia Business School: 690 average, with a middle 80 percent range of 615, 805
- Kellogg: 687 average, with a middle 80 percent range of 680, 770
- Harvard Business School: 685 median, with a middle 80 percent range of 645, 735
- MIT Sloan: 675 median, with a middle 80 percent range of 645, 735
- Wharton: 676 average
- Chicago Booth: 670 average, with a middle 80 percent range of 615, 725
If you are targeting M7 programs, a score of 685 or higher puts you at or above the median at most of these schools.2 However, the wide middle 80 percent ranges reveal an important truth: candidates with scores in the 620s and 630s still earn admission when other application elements are exceptional. Conversely, a 730 does not guarantee admission if the rest of your profile has weaknesses.
Top-15 Programs: Strong Competition at 665, 685
Programs ranked just outside the M7 reported typical GMAT Focus averages between 665 and 685 for recent entering classes.3 Dartmouth Tuck reported a 671 average, while NYU Stern came in at 682. Other schools in this tier, including Berkeley Haas, Yale SOM, Michigan Ross, Duke Fuqua, UCLA Anderson, Cornell Johnson, and Texas McCombs, generally cluster within this same range.
For applicants targeting this tier, scoring in the high 660s to low 680s places you competitively in the middle of the pack. Scoring above 685 positions you toward the upper end of most entering classes and can strengthen your candidacy, particularly if other parts of your application are less distinctive. You can compare MBA programs side by side to see how score expectations differ across schools.
Top-25 Programs: Competitive at 645, 675
Programs ranked in the 15 to 25 range typically report GMAT Focus averages between 645 and 675.4 Schools like Virginia Darden, Carnegie Mellon Tepper, UNC Kenan-Flagler, Indiana Kelley, Washington Foster, and Emory Goizueta fall into this category. A score in the mid-600s positions you competitively at these programs, while scoring above 670 places you toward the higher end of their admitted student profiles.
Context Matters More Than Rankings
These numbers provide useful benchmarks, but several factors can shift what counts as a "good" score for your specific situation:
- Underrepresented backgrounds: Some programs actively seek to diversify their class across industry, geography, or demographic lines. Applicants from underrepresented groups may find that a score slightly below the median is offset by other distinctive qualities.
- Test-optional policies: Several top MBA programs that don't require GMAT or GRE now accept applications without standardized test scores. If you have a strong GPA and compelling work experience, you may choose not to submit a score that falls below your target school's median.
- Section balance: Admissions committees notice if one section score is dramatically lower than others. A 685 total built on balanced section scores may be viewed more favorably than the same total with one weak area.
The published averages represent the midpoint of admitted students, meaning roughly half of each class scored below these figures. Your GMAT score opens doors, but it is your full application, including essays, recommendations, interviews, and work experience, that ultimately determines admission.
How Section-Score Mix Affects MBA Admissions
Admissions committees review your Quantitative, Verbal, and Data Insights scores individually alongside your 205, 805 total score. A 705 total composed of 90 Quant, 65 Verbal, and 70 Data Insights will be interpreted very differently from a balanced 85/85/85 profile, even though both candidates land at the same total. The mix of your section scores sends a signal about your analytical strengths, potential academic weaknesses, and fit for different program cultures.
Quantitative-Heavy Programs and Balanced Profiles
Schools with quantitatively demanding curricula such as Chicago Booth, MIT Sloan vs Harvard MBA comparisons confirm, and Columbia often place substantial weight on the Quant score. A candidate with a 90th-percentile Quant, 60th-percentile Verbal, and 70th-percentile Data Insights may fare better at these programs than a perfectly balanced scorer with all three sections at the 75th percentile, because the admissions committee knows the student can handle derivatives pricing, financial modeling, and operations research coursework. Conversely, schools known for leadership development, marketing strength, or integrative case methods (Kellogg, Fuqua, Ross) tend to value balance and communication skills more evenly. A Verbal score below the 50th percentile can raise questions about your ability to contribute in case discussions, write effective strategy memos, and lead cross-functional teams.
The Data Insights Wild Card
Data Insights is the newest section on the GMAT Focus Edition, and admissions offices are still calibrating how much weight to assign it relative to Quant and Verbal. In 2026, most top programs do not yet publish median Data Insights scores, but a weak DI performance paired with strong Quant and Verbal can still prompt concern. Data Insights measures table analysis, multi-source reasoning, and graphics interpretation: skills that map directly to consulting cases, market research, and data-driven decision-making. A score at the 40th percentile in Data Insights may suggest gaps in analytical reasoning or comfort with unfamiliar data formats, even if your algebra and reading comprehension are rock-solid.
A Practical Heuristic for Section Balance
Aim for no section score below the 50th percentile for your target tier, and ensure at least one section lands above the 75th percentile. For M7 and top-15 programs, strive for two sections at or above the 75th percentile and none below the 60th. You can review the full GMAT score range for MBA admissions in our reference table to benchmark your targets. If you have a pronounced section imbalance, address it proactively in an optional essay or through supplementary coursework, internships, or certification that demonstrates competence in the weaker domain. Admissions readers appreciate self-awareness and a plan to close the gap before matriculation.
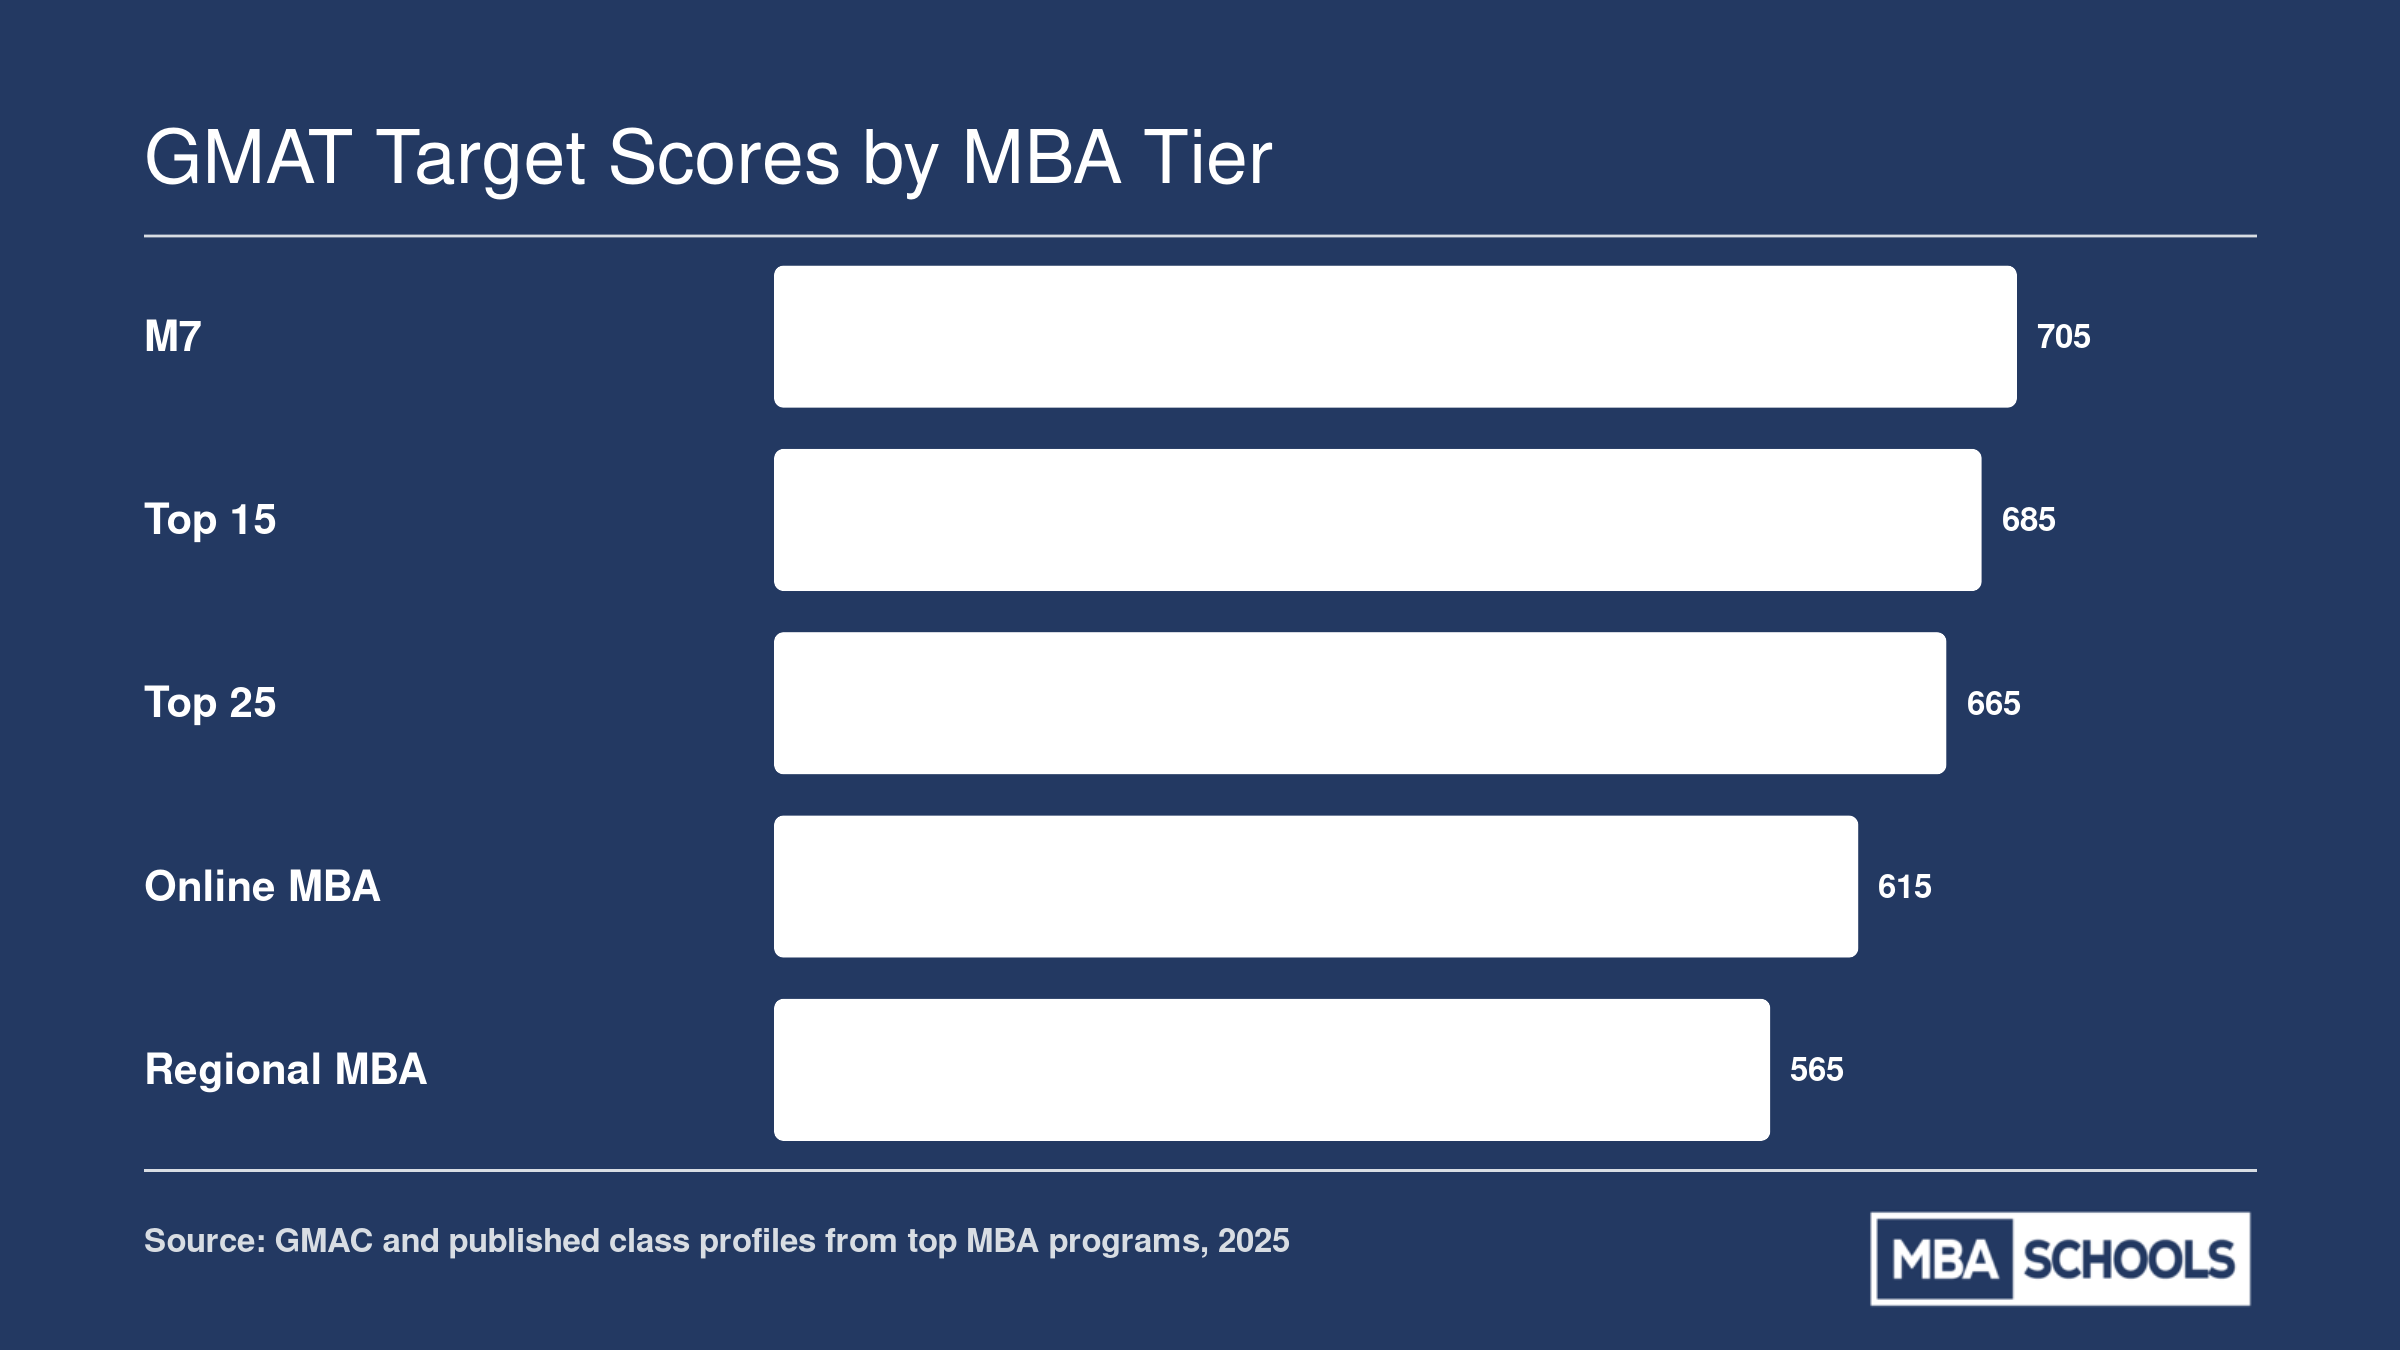
GMAT Target Scores by MBA Tier
Not every MBA program demands a 700-level score. The chart below maps typical GMAT Focus Edition total scores across five program tiers so you can quickly gauge where your result fits and how large the gap is between one tier and the next.
GMAT Scores, Percentiles, and Scholarship Outcomes
How much can a higher GMAT score increase your MBA scholarship offer? The honest answer is that precise, school-by-school thresholds are rarely published, and the relationship between test scores and merit aid is both meaningful and opaque. Schools rarely disclose formulas, but improving your GMAT percentile often strengthens your candidacy for competitive fellowships and tuition discounts. For a deeper look at available awards, explore our guide to MBA scholarships.
Finding Scholarship Score Thresholds
To uncover scholarship score benchmarks, contact the admissions office directly at each of your target MBA programs. Many schools share historical data or unofficial ranges during information sessions, campus visits, or one-on-one chats with admissions staff. Ask specific questions: "What GMAT scores did recent scholarship recipients typically present?" or "Is there a minimum score that qualifies candidates for merit consideration?" Staff may not quote exact cutoffs, but they can often describe the profile of competitive applicants for fellowships.
Using GMAC Reports and Aggregate Data
Check GMAC's official reports and surveys, such as the GMAC Prospective Students Survey, for aggregate scholarship data broken down by GMAT percentile bands. These publications occasionally show that candidates in higher percentile ranges receive merit aid at higher rates, though school-specific breakouts are rare. The reports confirm what admissions professionals know: a GMAT score above the school's published median often correlates with increased scholarship consideration, all else equal.
School Financial Aid Pages and Published Criteria
Browse school financial aid websites and published MBA cost breakdowns. Some programs list merit-based scholarship criteria on dedicated fellowship or scholarship committee pages. You may need to search for terms like "merit fellowship," "scholarship committee," or "dean's scholarship" to find relevant pages. Even when exact GMAT thresholds are not stated, schools often describe the academic and professional profile of past recipients, giving you a qualitative sense of competitiveness. If you are still narrowing your list, our guide on how to choose the right MBA program can help you weigh cost alongside other decision factors.
Gathering Anecdotal Evidence from Students and Alumni
Leverage conversations with current students or alumni on platforms like GMAT Club or Clear Admit to gather anecdotal evidence on how GMAT scores influenced scholarship offers. Alumni often share their own test scores, admitted-student profiles, and award amounts in forums or private messages. While these data points are unofficial and sample sizes are small, they provide real-world context that published statistics cannot capture.
Frequently Asked Questions About GMAT Scores
These are the questions working professionals ask most often when interpreting GMAT Focus Edition results. Each answer draws on the percentile data, concordance tables, and admissions benchmarks covered earlier in this guide.
Explore More
- Best GMAT Prep Courses
- Free GMAT Practice Tests & Questions
- GMAT Quant vs. MBA Classroom Math
- GMAT Quantitative Reasoning Guide
- GMAT Retake Policy & Score Sending Rules
- GMAT Study Schedule for Working Professionals
- GMAT Test Dates, Registration & Cost
- What Is a Good GMAT Score for MBA Programs?
- What to Do If GMAT Quant Is Your Weakest Section